Monitor Overview
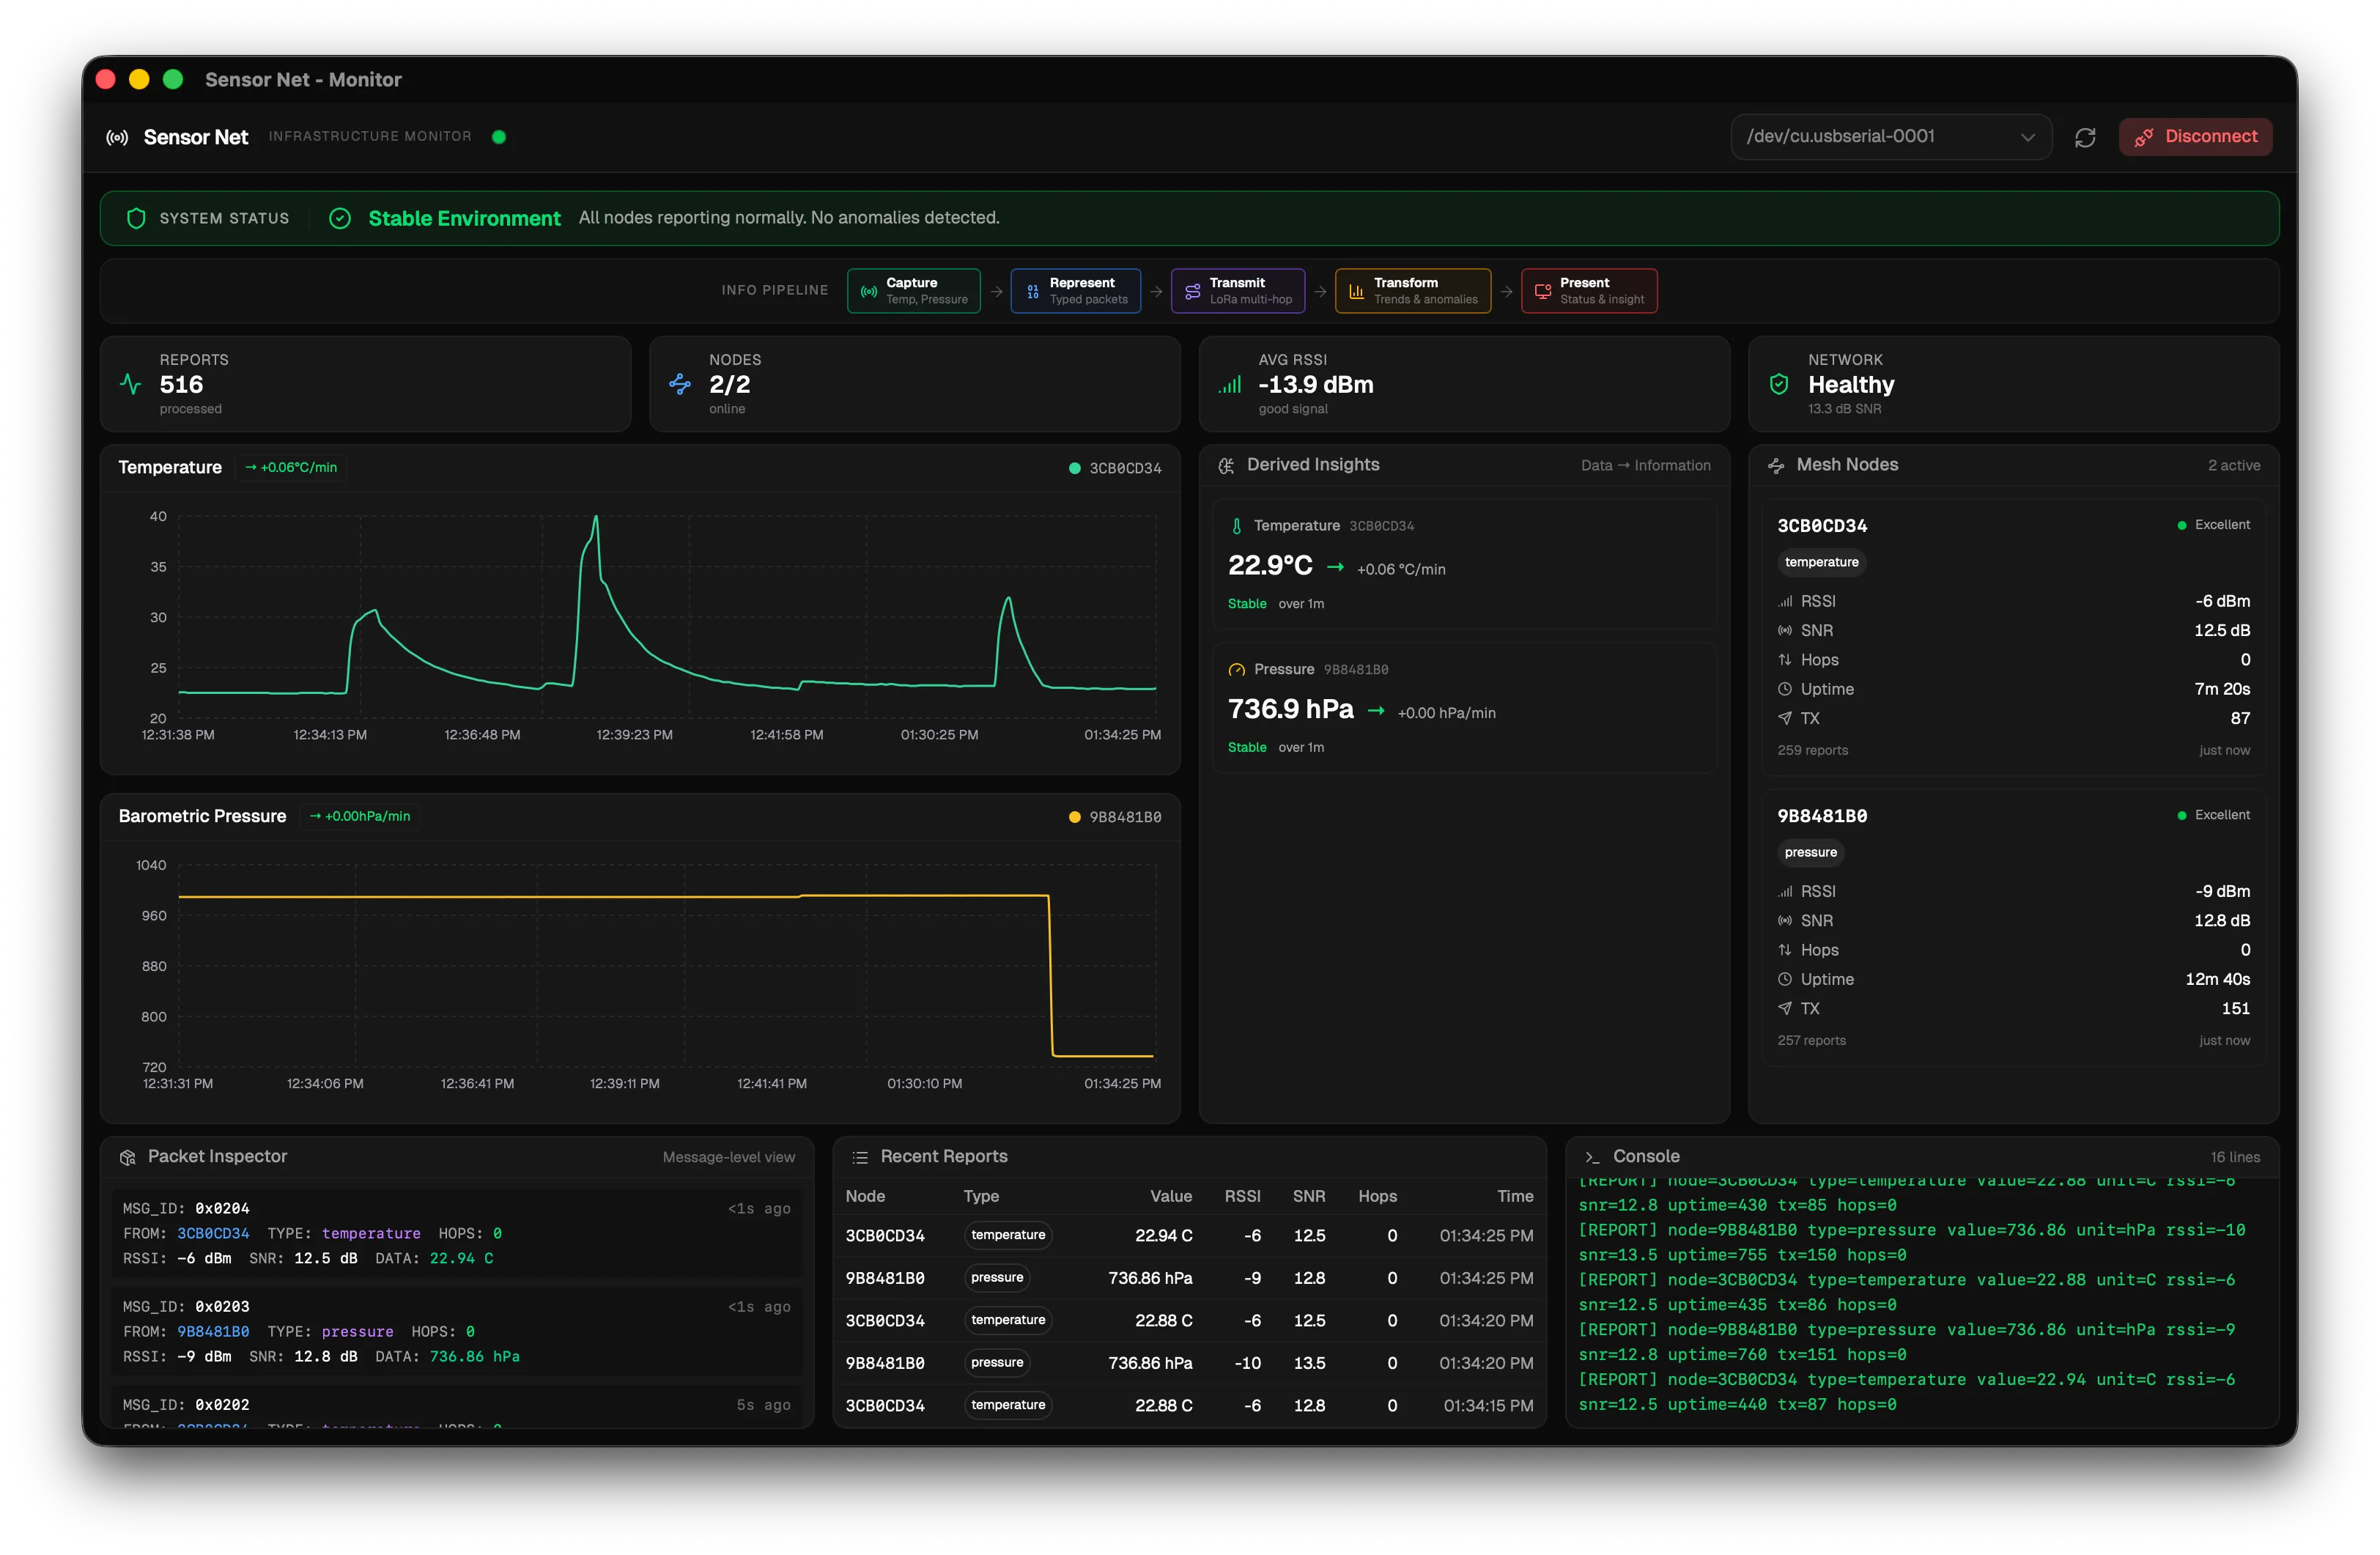
The Sensor Net monitor is a desktop application that connects to the receiver node over USB, reads incoming sensor data, and displays a live analytics dashboard. It is the “present” layer of the Information Internetworks data pipeline — turning raw sensor reports into meaningful visualizations.
Source Repository
Section titled “Source Repository”The monitor application lives in the sensor-net-monitor repository.
What It Does
Section titled “What It Does”The monitor application performs three functions:
- Reads data from the receiver. A Rust backend opens the USB serial port, reads lines from the receiver node, and parses each
[REPORT]line into structured data. - Stores data persistently. Parsed reports are inserted into a local SQLite database so historical data is retained across sessions.
- Renders a live dashboard. A React/TypeScript frontend polls the database and computes analytics (trends, anomalies, node health), then renders charts, status indicators, and detailed data tables.
Technology Stack
Section titled “Technology Stack”The application is built with Tauri, a framework for building desktop applications with a web frontend and a native backend.
| Layer | Technology | Role |
|---|---|---|
| Backend | Rust (Tauri) | Serial port I/O, SQLite database, command API |
| Frontend | React + TypeScript | Dashboard UI, analytics, data visualization |
| Bundler | Vite | Fast frontend build and hot reload |
| Styling | Tailwind CSS | Utility-first CSS framework |
| UI primitives | shadcn/ui | Pre-built accessible components (buttons, cards, etc.) |
| Package manager | Bun | Manages JavaScript dependencies |
Architecture Overview
Section titled “Architecture Overview”The application has a clear separation between the native backend and the web frontend.
Rust Backend (src-tauri/src/lib.rs)
Section titled “Rust Backend (src-tauri/src/lib.rs)”All native functionality lives in a single Rust file. It exposes Tauri commands that the frontend can call using invoke(), similar to an HTTP API but over an internal message bridge. The backend handles:
- Listing available serial ports
- Opening and closing the serial connection
- Parsing incoming serial data with a regex
- Writing parsed reports to SQLite
- Responding to frontend queries for node summaries, sensor data history, statistics, and recent reports
When a serial connection is opened, the backend spawns a background thread that reads lines from the serial port continuously. Each line is emitted to the frontend as a serial-log event. If a line matches the [REPORT] format, it is also parsed, inserted into the database, and a new-report event is emitted.
React Frontend (src/)
Section titled “React Frontend (src/)”The frontend is a standard React application with two custom hooks that manage all state:
useSerial— Tracks serial connection state, available ports, and raw log lines. Calls into Rust for port operations and listens for Tauri events.useMonitorData— Fetches database-backed data (node summaries, stats, sensor history, recent reports). Refreshes automatically onnew-reportevents and every 5 seconds as a fallback.
Both hooks are called in App.tsx and their return values flow down to child components as props. There is no global state library.
Analytics Layer (src/analytics/)
Section titled “Analytics Layer (src/analytics/)”Between the data hooks and the UI components sits a pure analytics layer. These are plain functions with no side effects and no UI — they take data in and return computed results:
| Function | Input | Output |
|---|---|---|
computeSensorInsights | Temperature and pressure history | Trend direction, rate of change, anomaly flags per sensor |
computeNodeHealth | Node summaries | Signal quality assessment and online/offline status per node |
computeSystemStatus | Insights + node health | Overall system health level (nominal, warning, critical) |
buildPacketInfos | Recent reports | Formatted packet display objects for the packet inspector |
App.tsx wraps these calls in useMemo so they only re-run when input data changes, not on every render.
Database
Section titled “Database”The application creates a SQLite database automatically on first launch. All sensor data is stored in a single reports table. The database file persists between sessions, so you can close and reopen the app without losing historical data.
| OS | Database Location |
|---|---|
| macOS | ~/Library/Application Support/lora-monitor/data.db |
| Windows | C:\Users\<You>\AppData\Roaming\lora-monitor\data.db |
| Linux | ~/.local/share/lora-monitor/data.db |
To start fresh, simply delete the data.db file. It will be recreated on the next launch.
Next Step
Section titled “Next Step”Proceed to Monitor Setup to install the prerequisites and clone the repository.